Digital Multimeter (DMM) + PyVISA Data Acquisition & Voltage Divider Lab Dataset
Product Description — This package contains a complete experiment on data acquisition using a Digital Multimeter (DMM) connected via NI-VISA (PyVISA), combined with full laboratory measurements, simulation references, and analytical calculations.
➡ https://creativedesigns840.gumroad.com/l/bgvvzp
Technical Dossier on Gumroad
price: €4.50 EUR
Digital Multimeter (DMM) + PyVISA Data Acquisition & Voltage Divider Lab Dataset
Perfect for: EE students • Lab report writers • Python DAQ learners • Instrumentation practice • Calibration experiments
This package contains a complete experiment on data acquisition using a Digital Multimeter (DMM) connected via NI-VISA (PyVISA), combined with full laboratory measurements, simulation references, and analytical calculations.
You get Python code, real hardware data, voltage divider experiments, potentiometer error characterization, and complete statistical comparison between DMM vs PyVISA readings.
What’s Inside (Full Contents)
- NI-VISA + PyVISA Setup File
Includes:
- Full connection instructions
- DAQ workflow with DMM Python code to:
- Detect VISA instruments
- Query IDN?
- Measure resistance
- Measure DC voltage
- Export measurements to CSV
- Ready-to-run in Jupyter Notebook.
- Basic Circuit Theorem: Voltage Divider
Contains:
- Circuit diagrams
- Simulation reference
- Equivalent circuit representations
- Real measurement data
- Images + oscilloscope screenshots
- Measurement Comparison: DMM vs PyVISA
Table includes:
- Actual component values
- DMM readings
- PyVISA readings
- Matching values to prove DAQ accuracy
- Potentiometer Variable Resistance → Voltage Measurement
For both DMM and PyVISA, you provide:
- Target potentiometer resistance
- Actual measured resistance
- Measured voltage
- Theoretical voltage
- % error in voltage
- % error in resistance
- Average total error analysis
- Linearization
- Graphical interpretation
This dataset is extremely valuable because it shows how real hardware deviates from theory, with comparisons across two measurement methods.
- Full Data Analysis
Included inside the Excel file:
- Graphs for DMM and PyVISA
- Linearity checks
- Error trend plots
- Percentage deviation tables
- Difference between theoretical and real values High-quality screenshots:
- Circuit diagrams
- Simulation results
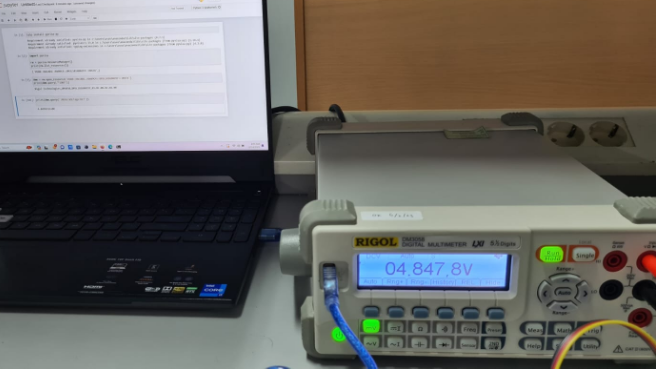
- DMM displays
- PyVISA output
- Graphs & analysis
Who Will Benefit
✔ Electrical engineering students
✔ Arduino/microcontroller learners
✔ Anyone learning PyVISA + instrument control
✔ Students writing lab reports
✔ Teachers building examples
✔ Anyone needing real hardware DAQ data
This dataset includes:
✔ Real DAQ instrument control code
✔ Multiple measurement sets
✔ Two different methods (DMM vs PyVISA)
✔ Full error analysis
✔ Graphs, screenshots, simulations
✔ Clean Excel tables
➡ https://creativedesigns840.gumroad.com/l/bgvvzp
Technical Dossier on Gumroad